solarpy.plotting.plot_bsrn_limits#
- solarpy.plotting.plot_bsrn_limits(irradiance, component, ghi_extra, xlim=(0, 1400), ylim=(0, 1600), min_limit_diff=15, scatter_vmax=None, cmap=None, s=1.5, bins=(200, 200), norm=None, ax=None)#
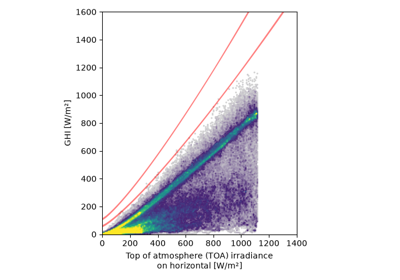
Plot scatter heatmaps of irradiance vs. extraterrestrial irradiance with BSRN limits visualized.
The plot can either plot GHI, DHI, or DNI, as a function of the extraterrestrial irradiance on a horizontal plane (ghi_extra) using
solarpy.plotting.plot_scatter_heatmap(). The extremely rare limits (ERL) and physically possible limits (PPL) fromsolarpy.quality.bsrn_limits()are overlaid as shaded bands.- Parameters:
irradiance (array-like of float) – Irradiance measurements [W/m²].
component ({"ghi", "dhi", "dni"}) – The type of irradiance measurements provided in irradiance.
ghi_extra (array-like of float) – Extraterrestrial irradiance on a horizontal plane [W/m²]. Must be the same length as irradiance.
xlim (tuple of float, optional) – Limits of the x-axis (extraterrestrial irradiance). Default is
(0, 1400).ylim (tuple of float, optional) – Limits of the y-axis (measured irradiance). Default is
(0, 1600).min_limit_diff (float, optional) – Minimum difference between the ERL and PPL limits for visibility purposes. Default is 15 W/m².
scatter_vmax (float, optional) – Upper bound of the scatter heatmap color scale. If
None(default),{"ghi": 175, "dhi": 250, "dni": 50}[component]is used.cmap (matplotlib.colors.Colormap, optional) – Colormap used for the scatter heatmaps. If
None(default),solarpy.plotting.two_part_colormap()is used.norm (matplotlib.colors.Normalize, optional) – Normalization for the scatter heatmaps. If
None(default), amatplotlib.colors.TwoSlopeNormwithvmin=1,vcenter=20, andvmax=scatter_vmaxis used.s (float, optional) – Marker size for the scatter heatmap. Default is 1.5.
bins (tuple of int, optional) – Number of bins for the scatter heatmap in the x and y directions. Default is
(200, 200).ax (matplotlib.axes.Axes, optional) – Axes to draw the plot on. If
None, a new figure with a single axis is created.
- Returns:
fig (matplotlib.figure.Figure) – The figure containing the heatmap.
ax (matplotlib.axes.Axes) – The axes containing the heatmap.
- Return type: