Note
Go to the end to download the full example code.
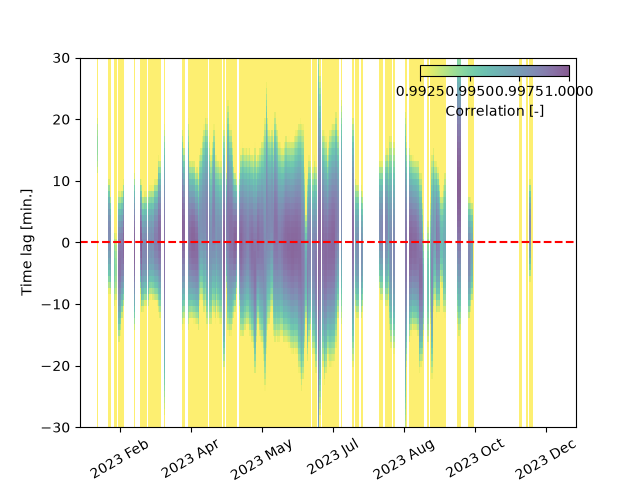
Time-drift correlation#
This example shows how to detect timestamp drift in irradiance
measurements using
solarpy.plotting.plot_time_drift_correlation().
import pvlib

import solarpy

# Read a year of 1-minute GHI measurements
data, meta = solarpy.iotools.read_t16(
    "https://raw.githubusercontent.com/AssessingSolar/solarpy/refs/heads/main/data/LYN_2023.csv",  # noqa: E501
    map_variables=True,
)

location = pvlib.location.Location(meta["latitude"], meta["longitude"])
clearsky = location.get_clearsky(data.index)
is_clearsky = pvlib.clearsky.detect_clearsky(
    data["ghi"], clearsky["ghi"], data.index
)

fig, ax = solarpy.plotting.plot_time_drift_correlation(
    times=data.index,
    ghi=data["ghi"],
    ghi_clear=clearsky["ghi"],
    is_clearsky=is_clearsky,
)
Total running time of the script: (0 minutes 4.359 seconds)
Estimated memory usage: 461 MB